Statistical Significance Calculator
Do you know why calculating statistical significance is important? Our calculator will help you determine whether the observed results in your data are likely due to chance or if they reflect a true effect or relationship.
Table of Contents
Do you ever wonder how researchers determine if their findings are truly meaningful or just random chance? The answer lies in calculating statistical significance.
This crucial process allows researchers to assess whether their study's results are likely to reflect a genuine effect or are simply the result of random variation. By understanding statistical significance, we can ensure that the conclusions drawn from data are reliable and trustworthy, providing a solid foundation for making informed decisions.

What is Statistical Significance?
Statistical significance is a measure used in hypothesis testing to determine whether a dataset's observed difference or relationship is likely to be genuine or if it could have occurred by random chance.
It is quantified by a p-value, which indicates the probability of obtaining the observed results or more extreme ones if the null hypothesis is true. A result is typically considered statistically significant if the p-value is below a predetermined threshold (commonly 0.05).
This suggests that the observed effect is unlikely to have occurred by chance alone and may reflect a true underlying phenomenon.
Example of Statistical Significance
Imagine a pharmaceutical company testing a new drug designed to lower blood pressure. They conduct a clinical trial with two groups: one receives the new drug, and the other receives a placebo. After several weeks, the researchers found that the group taking the drug had an average blood pressure reduction of 10 mmHg, while the placebo group showed no significant change.
To determine whether this difference is due to the drug's effectiveness or just random variation, the researchers calculate the p-value. If the p-value is 0.03 (below the commonly used threshold of 0.05), it suggests that there is only a 3% chance that the observed difference in blood pressure is due to random chance.
This would lead the researchers to conclude that the drug likely has a real effect on lowering blood pressure, and the result is considered statistically significant.
Why Calculating Statistical Significance Is Important?
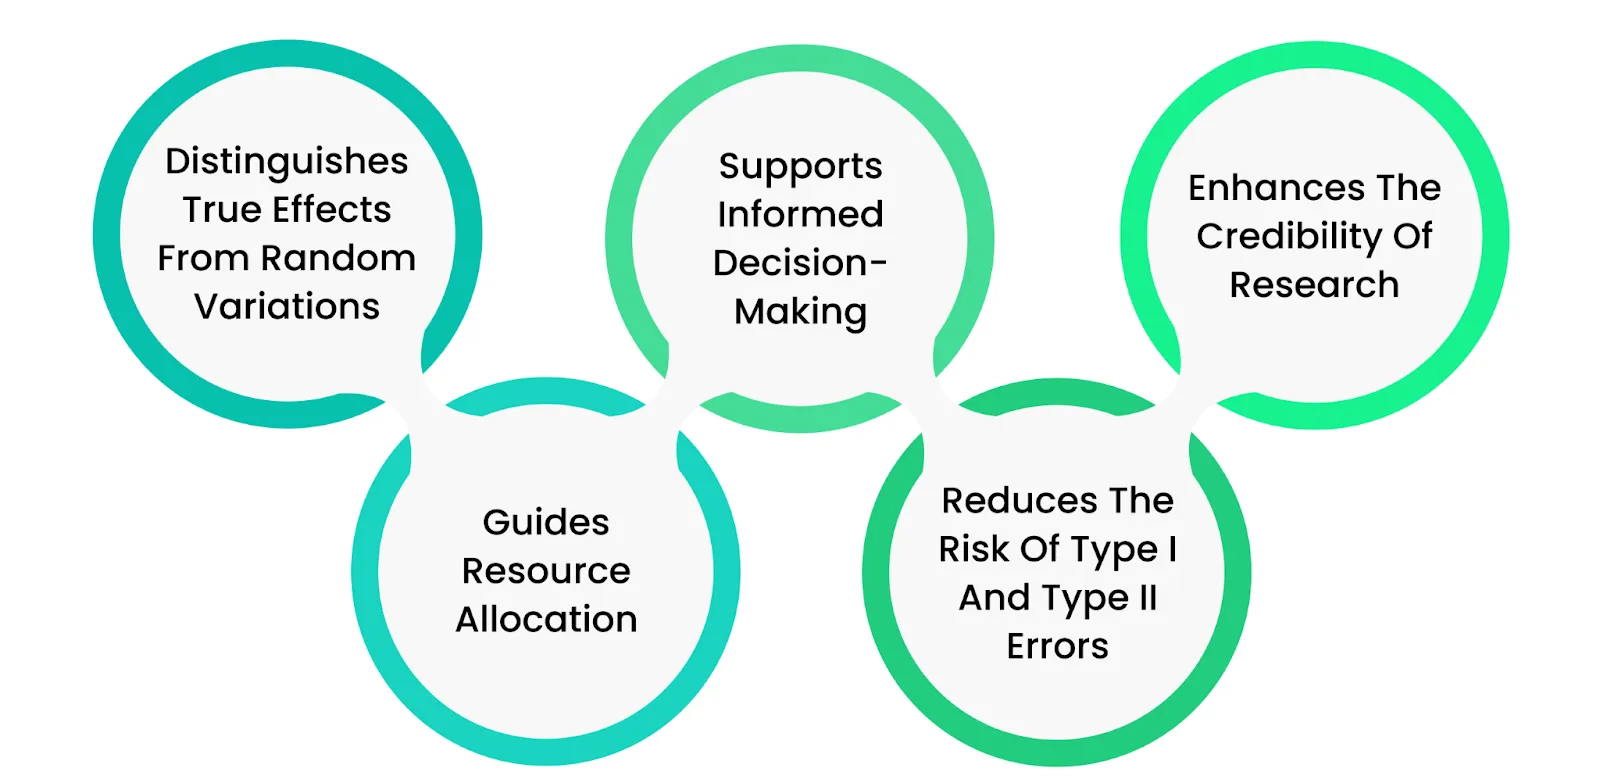
Calculating statistical significance is important for several key reasons, each of which plays a crucial role in the integrity and reliability of research findings:
Distinguishes True Effects from Random Variations
Statistical significance helps researchers determine whether the observed results in a study are likely to reflect a true effect rather than being due to random chance. This calculation would make it easier to differentiate between meaningful patterns and mere noise in the data, leading to potentially misleading conclusions.
Supports Informed Decision-Making
Decisions in fields like medicine, business, and social sciences are often based on the outcomes of research studies. By calculating statistical significance, decision-makers can rely on statistically validated evidence, reducing the risk of acting on information that may be incorrect or unreliable. This is especially critical when the stakes are high, such as in policy-making or clinical treatments.
Enhances the Credibility of Research
When results are statistically significant, they carry more weight and credibility within the scientific community. Peer-reviewed journals, funding bodies, and stakeholders often look for statistical significance as a quality and rigor research marker. It ensures that the findings are anecdotal and backed by robust data analysis.
Guides Resource Allocation
In research and development, resources such as time, money, and manpower are often limited. Statistical significance helps prioritize projects and experiments by highlighting which findings are worth further exploration or investment.
For example, a drug that shows statistically significant improvement in clinical trials is more likely to receive funding for further development.
Reduces the Risk of Type I and Type II Errors
Calculating statistical significance helps minimize errors in hypothesis testing. A Type I error occurs when a true null hypothesis (a false positive) is incorrectly rejected. In contrast, a Type II error occurs when a false null hypothesis is not rejected (a false negative).
Statistical significance testing helps control these errors by setting thresholds (such as the p-value) to make more accurate judgments about the data, thereby improving the overall reliability of the research conclusions.
How to Calculate Statistical Significance?
Calculating statistical significance involves several steps, typically following a standard process in hypothesis testing.
Here’s a step-by-step guide:
Formulate Hypotheses
- Null Hypothesis (H₀): This is the default assumption that there is no effect or difference.
- Alternative Hypothesis (H₁): This is what you aim to prove, indicating that there is an effect or difference.
Collect Data
Gather the data through experiments, surveys, or observational studies. Ensure the sample size is adequate to detect a significant effect if one exists.
Choose a Significance Level (α)
Commonly set at 0.05, this is the threshold for determining whether the observed results are statistically significant. A lower α (e.g., 0.01) means stricter criteria for significance.
Select the Appropriate Statistical Test
Depending on the data and hypothesis, choose a test such as:
- T-test: This is used to compare means between two groups.
- Chi-square test: For categorical data.
- ANOVA: For comparing means among three or more groups.
- Regression analysis: To examine relationships between variables.
Calculate the Test Statistic
This involves computing a value using the chosen statistical test formula (e.g., a t-value or a chi-square value).
Find the p-value
The p-value represents the probability of obtaining the observed results or more extreme ones if the null hypothesis is true. This can be found using statistical software, tables, or calculators.
Compare the p-value to the Significance Level (α)
- If p-value ≤ α: Reject the null hypothesis (H₀). The result is statistically significant, indicating strong evidence against the null hypothesis.
- If p-value > α: Fail to reject the null hypothesis. The result is not statistically significant, suggesting insufficient evidence to support the alternative hypothesis.
How Do You Know When Something Is Statistically Significant?
To determine whether something is statistically significant, follow these steps:
Set a Significance Level (α)
Common Levels: The most commonly used significance level is 0.05, but depending on the field and the context, you might use 0.01 or 0.10. This value represents the probability of rejecting the null hypothesis when it is true (Type I error).
Conduct the Appropriate Statistical Test
Choose a statistical test (e.g., t-test, chi-square test, ANOVA, etc.) depending on your data and hypothesis. Perform the test on your collected data to calculate the test statistic (e.g., t-value, chi-square value).
Calculate the p-value
The p-value is the probability of obtaining an effect at least as extreme as the one in your sample data, assuming the null hypothesis is true. It tells you how likely your observed data would occur under the null hypothesis.
Compare the p-value to the Significance Level (α)
- p-value ≤ α: The result is considered statistically significant if the p-value is less than or equal to the significance level. This means strong evidence against the null hypothesis suggests that the observed effect is likely real and not due to chance.
- p-value > α: The result is not statistically significant if the p-value exceeds the significance level. This means insufficient evidence exists to reject the null hypothesis, and the observed effect could be due to random variation.
Final Words
A statistical significance calculator is a vital tool for researchers and analysts seeking to determine the reliability of their data and the validity of their findings.
This calculator provides a p-value to help assess whether observed differences or effects in a study are likely genuine or merely the result of random variation. Its application spans various fields, from scientific research to business analytics, ensuring that decisions and conclusions are grounded in robust statistical evidence.
Ultimately, using a statistical significance calculator enhances the credibility of research outcomes and supports more informed decision-making, making it an indispensable asset in the quest for reliable and meaningful insights.
Frequently Asked Questions
What is statistical significance?
Statistical significance is a measure used in hypothesis testing to determine whether the observed difference or relationship in a dataset is likely to be genuine or occurs by random chance. It is often quantified by a p-value.
Why is it important to calculate statistical significance?
Calculating statistical significance is crucial because it helps distinguish true effects from random variations, supports informed decision-making, enhances the credibility of research, guides resource allocation, and reduces the risk of Type I and Type II errors.
What is a p-value?
A p-value is the probability of observing the data (or something more extreme) if the null hypothesis is true. A low p-value indicates that the observed results are unlikely to have occurred by chance, suggesting statistical significance.
What happens if the p-value is above 0.05?
If the p-value is above 0.05, it suggests that the observed results may not be statistically significant, meaning that the results are more likely to be due to random chance rather than a true effect.