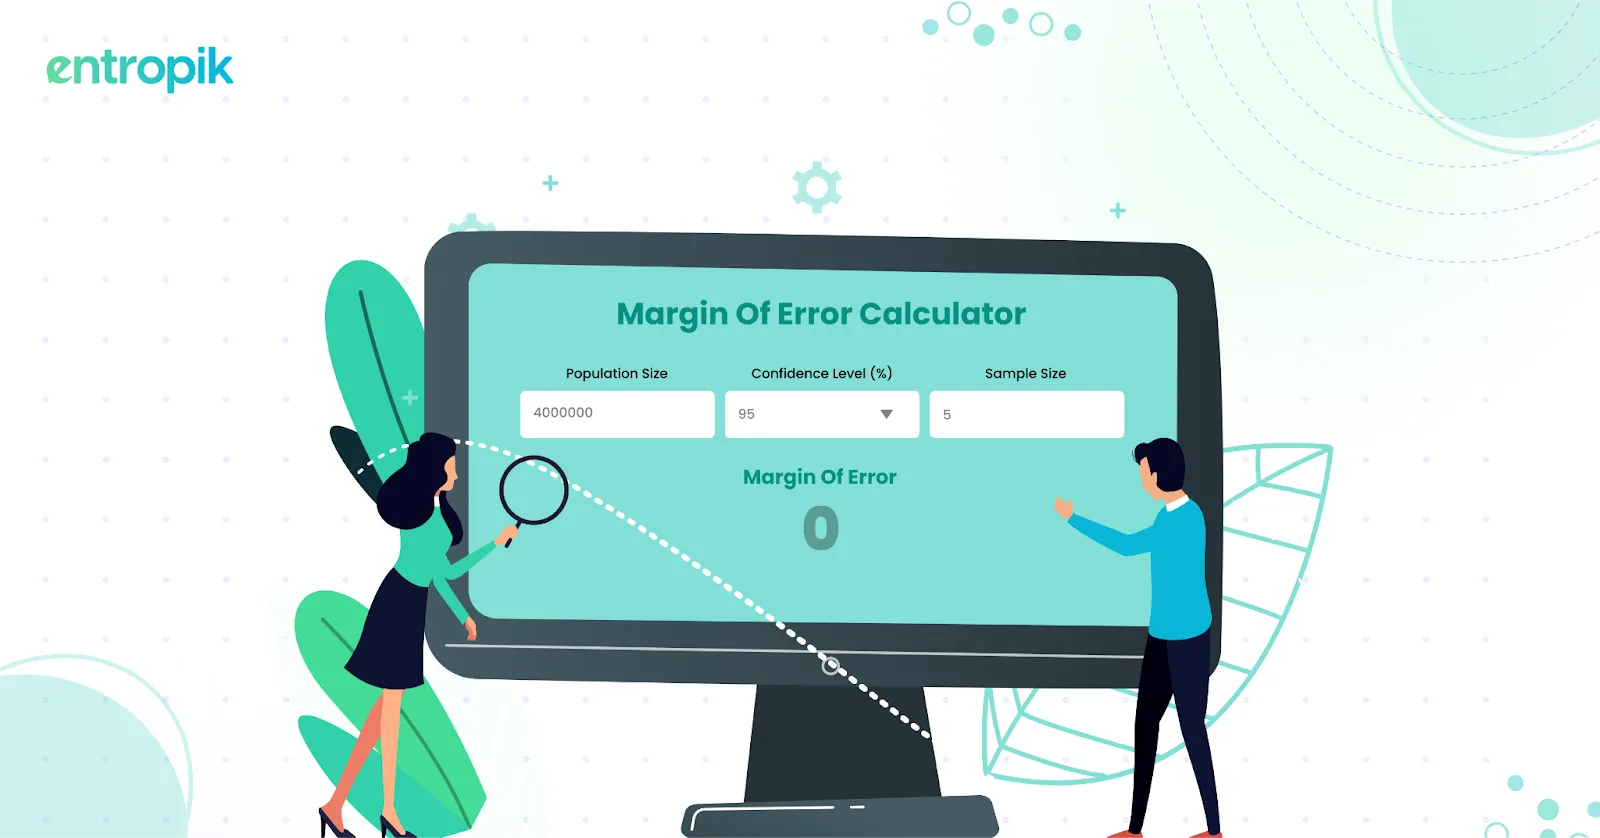
Margin of Error Calculator
Are you wondering why calculating the margin of error is crucial for interpreting survey results? Our tool simplifies the process, saving you time and ensuring precise calculations.
0%
Margin of Error (%)
Table of Contents
Calculating the margin of error is important because it shows how accurate survey results and data analyses are. Providing a range within which the true value is likely to fall helps assess the data's reliability. This measurement allows researchers and analysts to understand their findings' potential variability and uncertainty.
What is a Margin of Error?
The margin of error shows how much a survey or study's results might differ from the true value. It gives a range around the results, indicating how accurate they are.
A smaller margin of error means you can be more confident in your results, likely closer to the true values. Conversely, a larger margin of error indicates that the results could vary more widely from the entire population's opinions.
For example, if a company wants to survey a population of 50,000 people with a margin of error of ±4% at a confidence level of 95%, based on standard calculations, it would need a sample size of approximately 600 respondents.
The margin of error is crucial for understanding survey results. It quantifies uncertainty and helps evaluate the reliability of the findings.
For instance, if a survey indicates that 70% of respondents favor Service X over Service Y, with a margin of error of ±2% at a 95% confidence level, it means there's a high likelihood (95%) that the true proportion of people who prefer Service X is between 68% and 72%.
When to Use Margin of Error?
The margin of error is particularly useful in several contexts.
It is essential when interpreting survey results, as it helps gauge how closely the findings reflect the true opinions of the entire population. This is also true for polling data, which provides insight into the potential variability of political polls, market research, and public opinion.
In sampling studies, such as those in social sciences, healthcare research, and business analysis, the margin of error helps estimate the reliability of the research based on a sample. It plays a crucial role in data analysis by accounting for uncertainty and providing a range of values where the true result is likely to fall.
Additionally, when making decisions based on data, understanding the margin of error allows for a better assessment of the information's precision and helps manage associated risks.
How to Calculate Margin of Error?
To calculate the margin of error, follow these steps:
Determine the Sample Size (n)
This is the number of respondents or observations in your sample.
Find the Standard Deviation (σ)
This measures the dispersion of your sample data. If the population standard deviation is unknown, use the sample standard deviation.
Calculate the Standard Error (SE)
The standard error is the standard deviation divided by the square root of the sample size.

Choose a Confidence Level
This typically corresponds to a Z-score. Common confidence levels are 90%, 95%, and 99%, with Z-scores of approximately 1.645, 1.96, and 2.576, respectively.
Compute the Margin of Error (ME)
Multiply the standard error by the Z-score for your chosen confidence level.

Let's demonstrate how the margin of error calculator works with an example:
Imagine a company wants to survey 500 customers to understand their satisfaction with a new product. They find that the sample standard deviation of satisfaction scores is 10. They want to be 95% confident in their results.
- Determine the Sample Size (n): 500 customers.
- Find the Standard Deviation (σ): 10 (sample standard deviation).
- Calculate the Standard Error (SE):
SE = 100/√500 = 0.447
- Choose a Confidence Level: For a 95% confidence level, the Z-score is approximately 1.96.
- Compute the Margin of Error (ME):
ME = Z × SE = 1.96×0.447 ≈ 0.875
So, the margin of error is ±0.875.
If the survey reports an average satisfaction score of 75, you can be 95% confident that the true average satisfaction score for the entire customer base falls between 74.125 and 75.875.
How to Interpret the Margin of Error?
Interpreting the margin of error involves understanding the range within which the true value will likely fall.
Here’s how to interpret it:
Range of Values
The margin of error provides a range around the survey result or statistic. For example, if a survey shows 60% support with a margin of error of ±4%, the true level of support is likely between 56% and 64%.
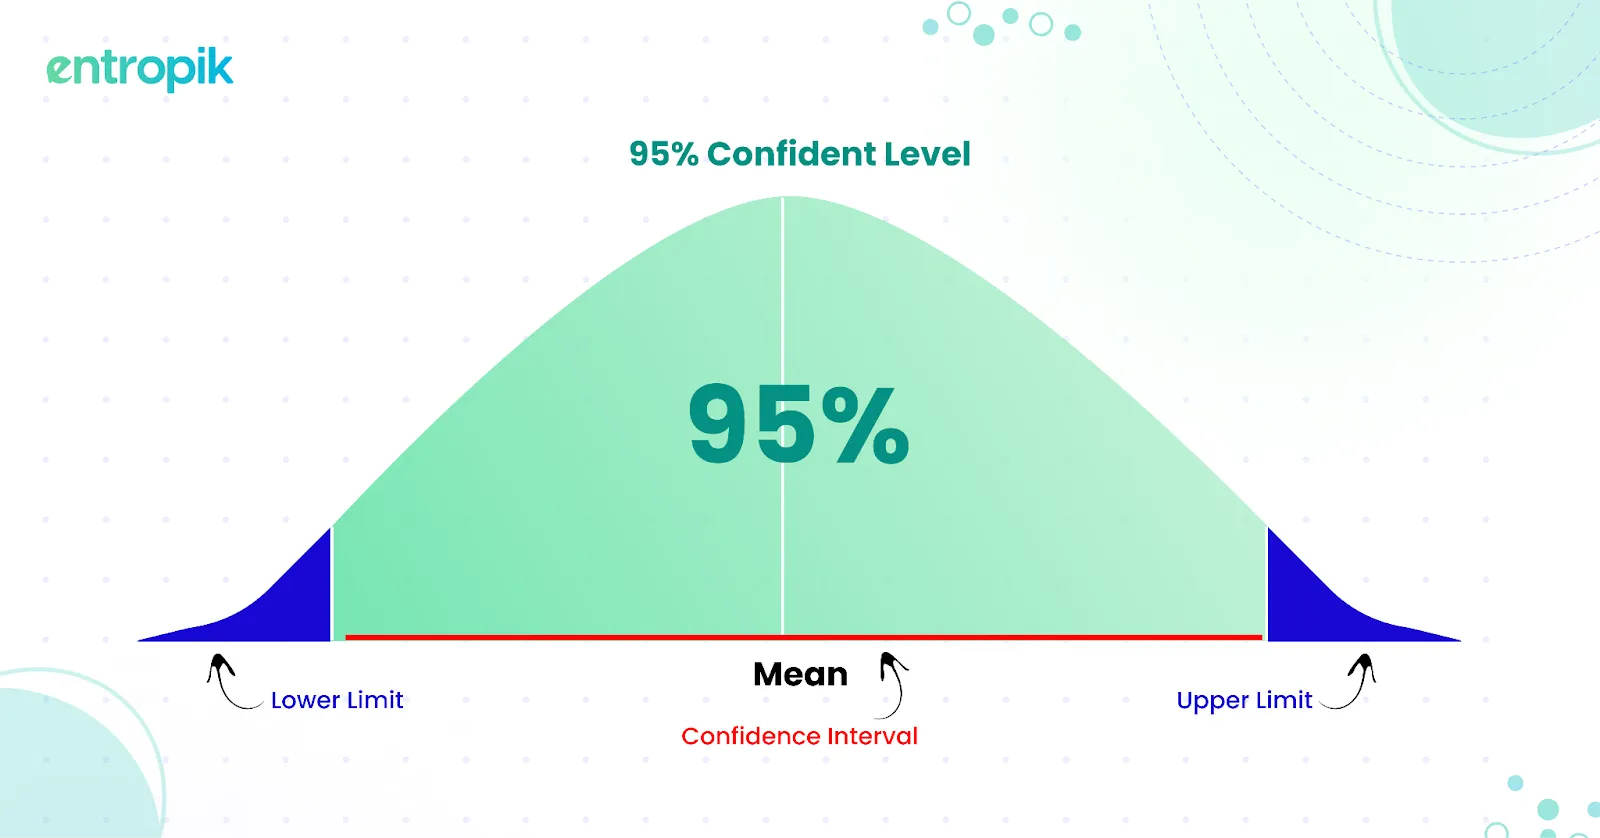
Confidence Level
The margin of error is associated with a confidence level, such as 95%. This means you can be 95% confident that the true value lies within the specified range. The confidence level indicates how often the margin of error would capture the true value if you repeated the survey many times.
Precision and Reliability
A smaller margin of error suggests greater precision and reliability of the results. Conversely, a larger margin of error indicates more uncertainty and variability.
Decision Making
When using survey results or statistical estimates, consider the margin of error to understand the potential variability and ensure informed decision-making based on the data.
What Are the Factors That Influence Margin of Error?
Several factors influence the margin of error:
Sample Size
Larger sample sizes generally lead to a smaller margin of error because they provide a more accurate representation of the population. Smaller sample sizes increase the margin of error and reduce precision.
Population Size
While the impact of population size is less significant for large populations, it can affect the margin of error in smaller populations. For large populations, the margin of error is primarily influenced by the sample size.
Variability in Data
Greater variability or diversity in the data (standard deviation) increases the margin of error. If the responses are more spread out, the margin of error will be larger.
Confidence Level
A higher confidence level (e.g., 99% vs. 95%) increases the margin of error because it requires a wider range to ensure the true value is captured with greater certainty—conversely, a lower confidence level results in a smaller margin of error.
Measurement Error
Errors or inaccuracies in data collection and measurement can affect the margin of error, making it larger if there are significant discrepancies.
How Can You Enhance Your Margin of Error Accuracy with Qatalyst?
You can reduce your margin of error by increasing your sample size with Qatalyst.
Qatalyst Audiences provides a robust platform for efficiently gathering high-quality data from a representative audience that matches your target market. Get access to 80 million+ respondents across 120+ countries through seamless integrations.
Whether introducing a new product, measuring customer satisfaction, or conducting academic research, our platform offers the tools necessary to connect with your target audience and obtain valuable insights.
Frequently Asked Questions
Why is understanding the Margin of Error important?
Understanding the margin of error is crucial because it quantifies the uncertainty in survey results and data analyses. It helps assess the reliability of findings and gives researchers and analysts insight into their results' potential variability and accuracy.
What does a smaller or larger Margin of Error indicate?
A smaller margin of error indicates greater confidence in the results, suggesting they are likely closer to the true values of the population. However, a larger margin of error suggests greater variability and less certainty about how closely the results reflect the true opinions of the population.
Can I use the Margin of Error Calculator for any survey?
Yes, the Margin of Error Calculator can be used for different surveys and studies, provided you have the necessary data such as population size, sample size, and confidence level.
What happens if I don't consider the Margin of Error in my analysis?
Not considering the margin of error can lead to misinterpretation of survey results and potentially faulty conclusions. It is essential for gauging the reliability and precision of the findings.