“The first step in exceeding your customer's expectations is to know those expectations.”
Roy H. Williams
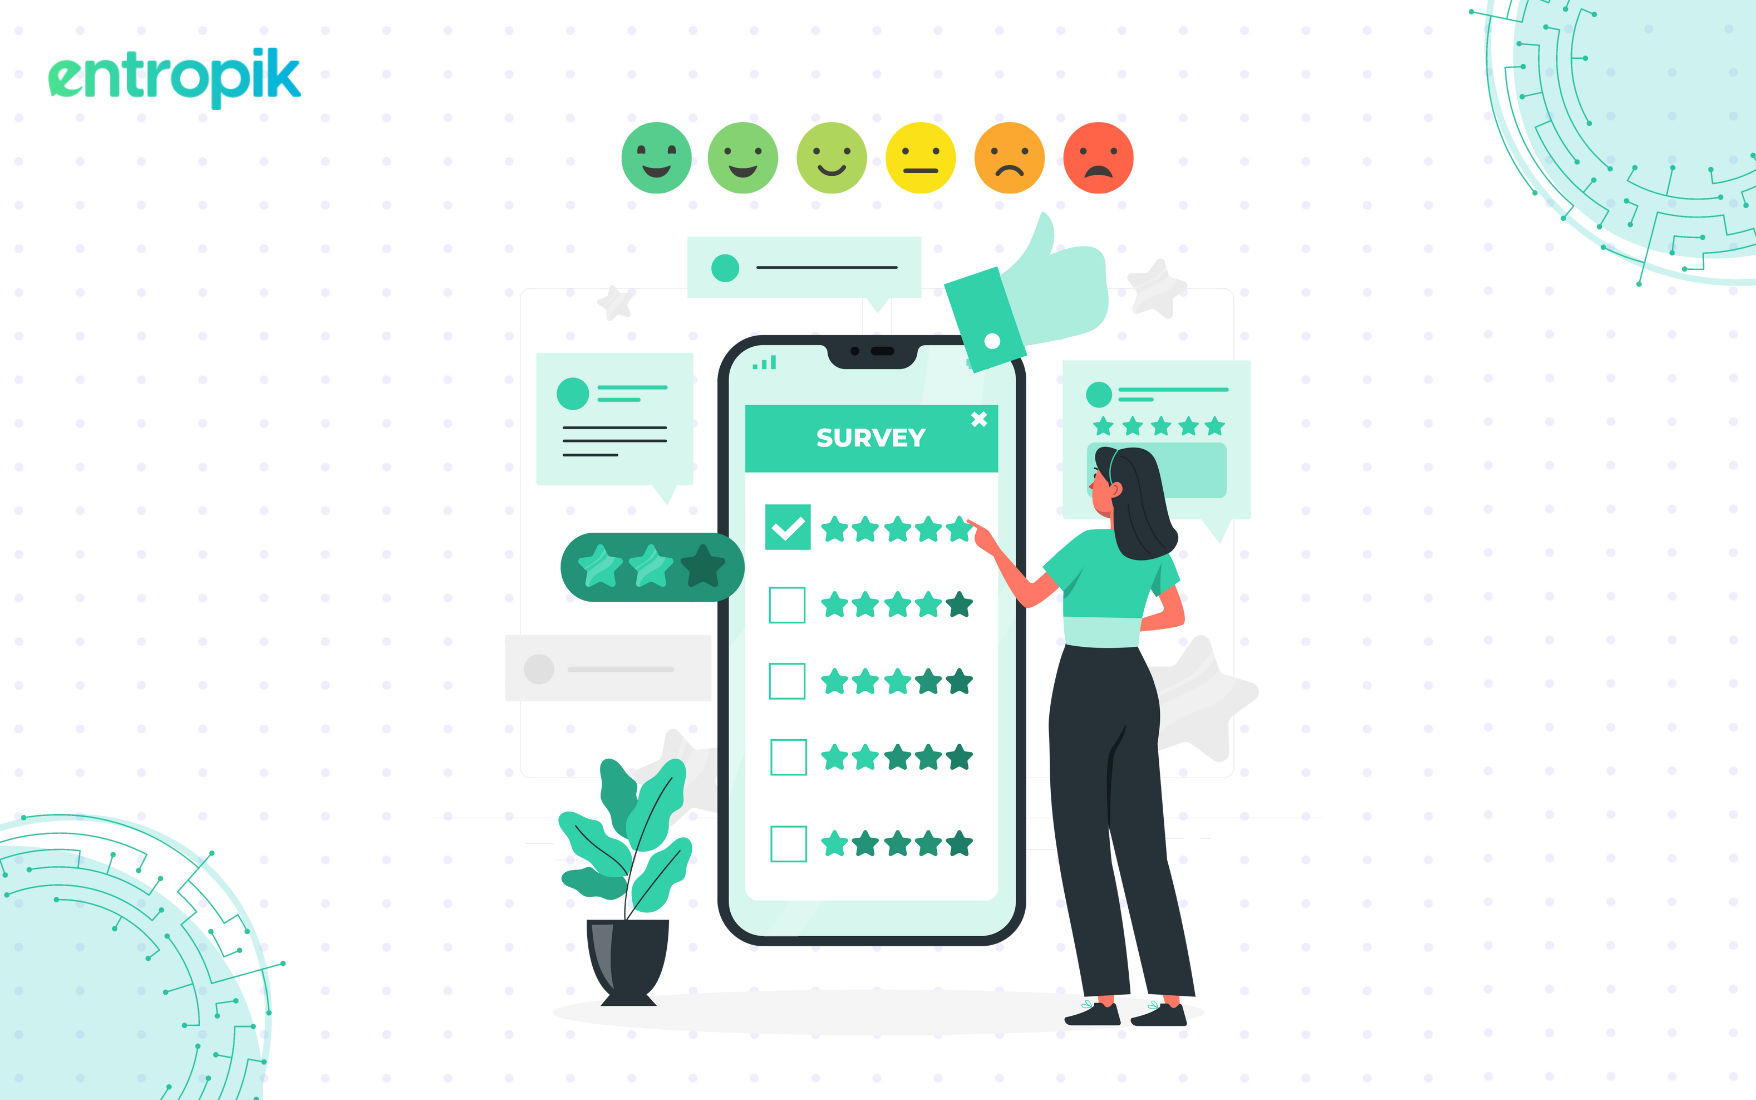
Measuring the success of a product goes beyond acquiring new customers. Retaining existing ones and having them recommend your product to others is equally important. But how can you tell if your customers are satisfied enough to become loyal promoters Conducting a Net Promoter Score (NPS) survey is a simple yet effective way to help you measure just that. By definition, NPS surveys helps quantify how likely a customer is to recommend your product to friends, family or colleagues.
How do you gather the NPS score?
The NPS is very simple to gather – it involves users answering a simple question such as ‘How likely is it that you will recommend this product to friends and family? on an 11-point scale (0-10). The higher the score is, the more likely they are to recommend your product. Based on the users’ responses, they are divided into three categories:
Detractors (0-6): These users are generally dissatisfied with your product and might switch to a competitor or are unlikely to recommend it to new users.
Passives (7-8): These users are reasonably satisfied with your product but are not likely to actively recommend it to others.
Promoters (9-10): These users are loyal and are extremely satisfied with your product and will recommend it to others or bring new business in.
The actual NPS score is calculated by subtracting the percentage of detractors from the percentage of promoters (% of Promoters - % of Detractors). NPS scores generally have a value between -100 and 100, with any score above 0 indicating positive reviews. For example, let’s say that you’ve sent the survey out to 100 users, out of which there are 60 promoters, 11 passives and 29 detractors. In this case, the NPS will be (% of Promoters - % of Detractors) 60 – 29 = 31.
How should you interpret NPS scores?
Negative scores generally indicate that your product is generally more disliked than liked. However, this is not an absolute – it is important to look at the general industry averages. For example, if the general NPS score for other products in your industry is -25 and your product’s score is -15, it could still mean that your product is doing relatively well.
Another thing you should do is track how your NPS scores change over time. For example, if your NPS score was -10 the first time you conducted it but has since changed to 5, you should consider it a net progress and a good sign rather than just a low score.
Are there any best practices to employ while conducting NPS surveys?
To get the most out of your NPS survey, here are some things you need to keep in mind:
Timing: The best time to send an NPS survey is just after the user has had an interaction with your product. This can be after they've completed a task or immediately after they've made a purchase.
Frequency: NPS surveys should be sent periodically to track changes in user satisfaction over time. However, sending surveys too frequently can lead to survey fatigue and reduced response rates, so it's important to find the right balance.
Incentives: Offering incentives, such as discounts or rewards, can also increase response rates. However, it's important to ensure that the incentives do lead to bias in the responses.
Analysis: Once you have collected the responses, analyze the data to identify trends and patterns. Look for patterns in the feedback and identify areas that need improvement.
Follow-up: Follow up with users who gave negative feedback to understand their concerns and work on addressing them.
Are there limitations to NPS surveys?
While NPS surveys can be broadly useful in helping you understand, they do have some limitations. One of the biggest limitations is that NPS scores cannot be used in isolation. While NPS scores give an idea of the general trend of satisfaction/dissatisfaction of users, they cannot help with the ‘why’. Therefore, NPS scores must always be used in conjunction with other qualitative survey methods to understand why users are dissatisfied with your product.
Bias is also another factor that can creep in while conducting an NPS survey. For example, choosing the wrong panel of users for your survey can lead to sampling bias, and can either inflate or decrease your NPS score.
Apart from these, there is also the risk of survey fatigue if conducted too frequently, the inability to compare NPS across different industries, and the need for other metrics to complement NPS.
In conclusion
Conducting user research is a great way to help your customers better, and NPS surveys is one of the ways you can do this. While NPS can be a great asset to provide valuable insights into customer loyalty and satisfaction, it should not be the only metric used to measure success. It is important to combine it with other metrics such as System Usability Scale (SUS), the Customer Effort Score (CES) or the Customer Satisfaction Score (CSAT) to gain a comprehensive understanding of your product’s strengths and weaknesses. By using a combination of these methods, you can identify areas of improvement and make data-driven decisions to enhance customer experience. Ultimately, the key to success is to continuously analyze and optimize your metrics to improve customer satisfaction and drive business growth.
{{cta-button}}


.jpg)


