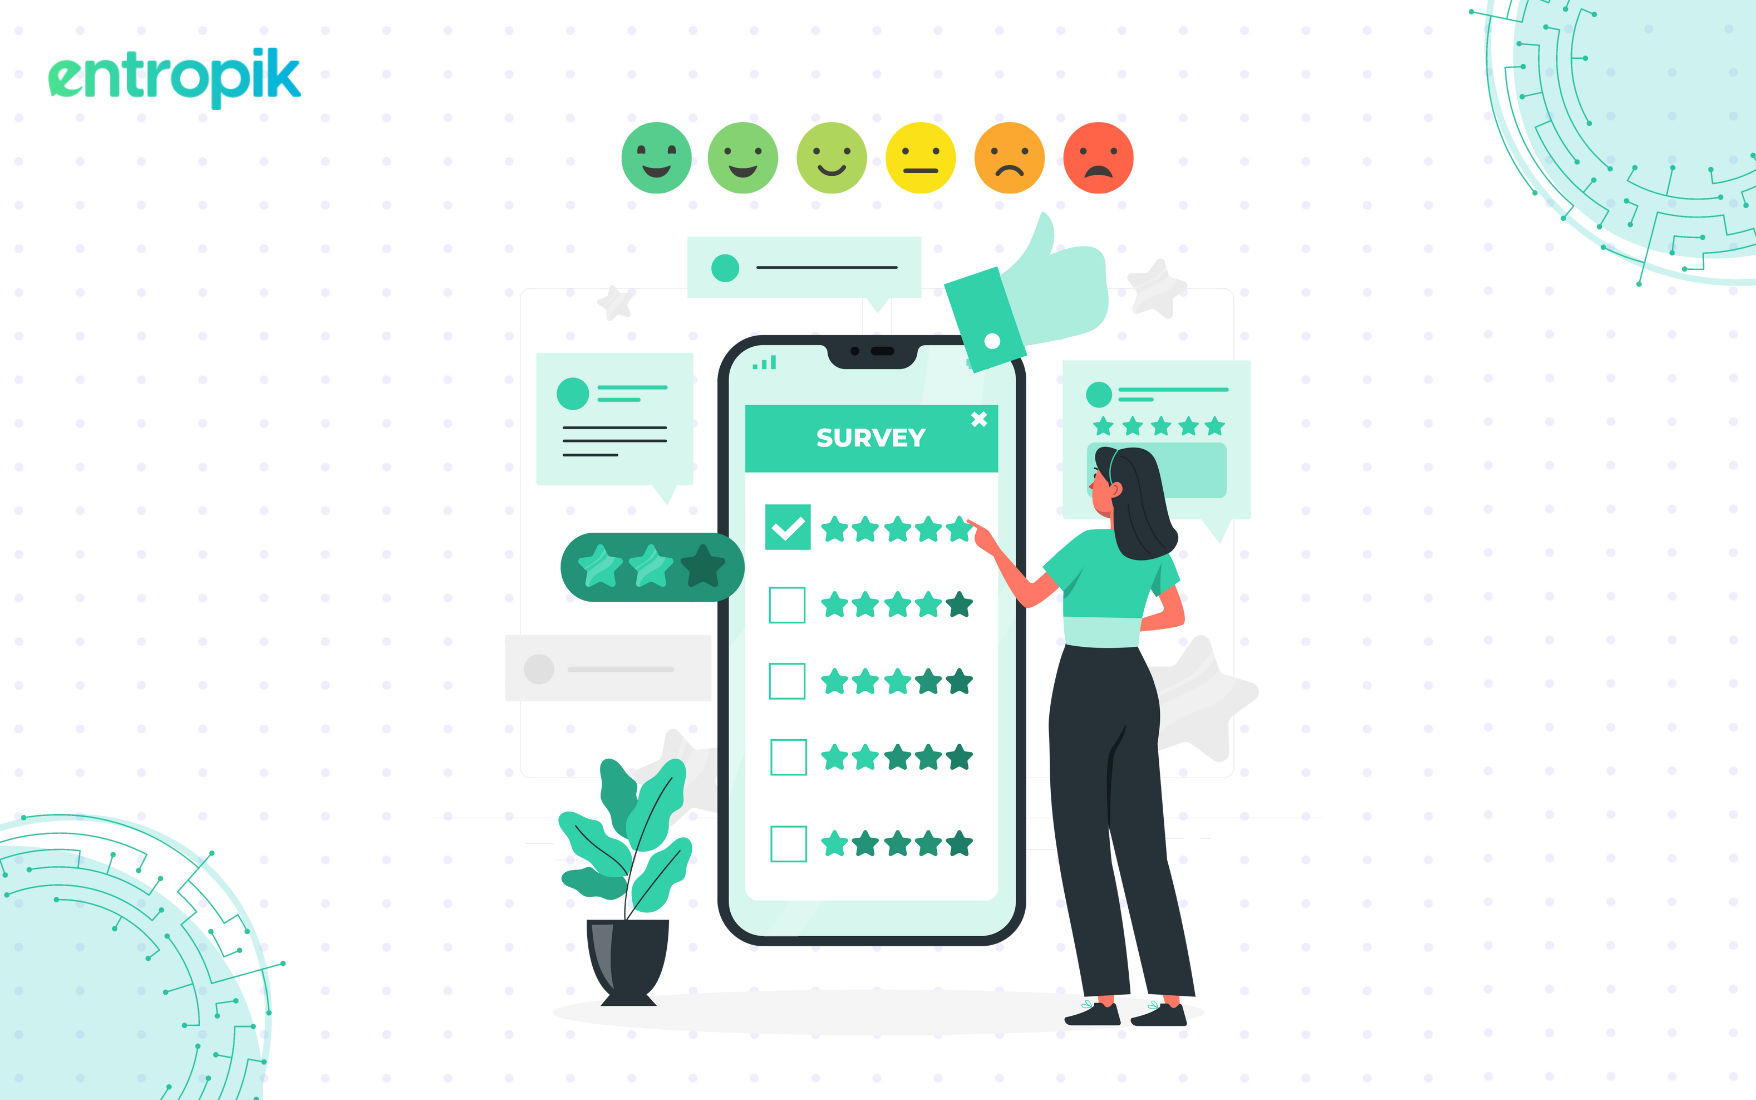
Collecting data on opinions and attitudes can be challenging, as these aspects are inherently subjective and vary greatly among individuals. To navigate this complexity, researchers often employ Likert scales, a popular method for measuring attitudes and opinions quantitatively.
Developed by psychologist Rensis Likert, these scales provide a range of options, allowing respondents to express the intensity of their feelings. This structured approach simplifies the analysis of complex human emotions, offering valuable insights for fields ranging from market research to psychology.
What is a Likert scale?
A Likert scale is a psychometric scale commonly used in surveys to measure respondent attitudes, opinions, or perceptions. It consists of a series of statements, and respondents indicate their level of agreement or disagreement on a multi-point scale, typically ranging from "strongly disagree" to "strongly agree." This scale helps quantify subjective data, making it easier to analyze and interpret responses.
What are the advantages of Likert scales?
Simplicity and ease of use
Likert scales are straightforward for both respondents and researchers. They present a clear and simple method for individuals to express their opinions or attitudes. Respondents find it easy to understand and use, which increases the likelihood of getting accurate responses. For instance, when surveying customer satisfaction, a statement like "I am satisfied with the customer service" followed by a scale from "strongly disagree" to "strongly agree" allows customers to convey their feelings efficiently.
Quantifiable data
One significant advantage of Likert scales is that they convert qualitative data into quantitative data, making it easier to analyze statistically. This transformation allows researchers to apply various statistical tools to identify trends, patterns, and correlations. For example, a company can analyze survey data on employee satisfaction by calculating the average scores for different aspects like workplace environment, management, and job satisfaction.
Flexibility in design
Likert scales offer flexibility in their design, allowing researchers to tailor them according to the study's needs. They can vary the number of response options, typically ranging from three to seven points, depending on the level of detail required. Additionally, researchers can choose between balanced (equal positive and negative options) and unbalanced scales (more positive or negative options). For example, a balanced five-point scale might include "strongly disagree, disagree, neutral, agree, strongly agree," while an unbalanced one might add options like "somewhat agree" for more nuanced responses.
Enhanced reliability and validity
Likert scales tend to produce reliable and valid results, especially when multiple items measure the same construct. Aggregating responses across several items helps to mitigate the effects of any outlier responses or biases. One of the many Likert scale examples could be measuring customer satisfaction with multiple statements about different service aspects (e.g., speed, friendliness, and accuracy) and averaging the scores provides a more reliable assessment than a single-question survey.
Ease of comparison
Likert scales facilitate comparison across different groups or time periods. By standardizing responses on a common scale, researchers can easily compare data from different segments or track changes over time. For instance, a company can compare employee engagement scores across different departments or monitor changes in customer satisfaction before and after implementing a new service policy. This comparative capability is crucial for identifying trends, making informed decisions, and assessing the impact of changes or interventions effectively.
Versatility across various fields
Likert scales are versatile and applicable across a wide range of fields, including psychology, marketing, education, and healthcare. In psychology, they can measure attitudes or personality traits; in marketing, they gauge consumer preferences; in education, they assess student satisfaction; and in healthcare, they evaluate patient experiences. For example, in healthcare, a Likert scale might be used to assess patient satisfaction with different aspects of care, such as "The medical staff were courteous" rated from "strongly disagree" to "strongly agree."
Ability to capture nuanced opinions
Likert scales allow respondents to express nuanced opinions rather than forcing a binary choice. This capability provides more detailed insights into attitudes and behaviors. For instance, in a survey about environmental attitudes, respondents might rate their agreement with statements like "I am willing to pay more for eco-friendly products" on a scale from "strongly disagree" to "strongly agree." This helps researchers understand the degree of support or opposition, leading to more granular and actionable insights.
Facilitates complex analysis
The data generated from Likert scales can be used for complex statistical analyses, such as factor analysis, regression, and correlation. This potential allows researchers to uncover deeper insights and relationships within the data. For example, a factor analysis of customer satisfaction survey data might reveal underlying dimensions such as "service quality" and "product quality," helping the company prioritize areas for improvement.
Efficient data collection
Likert scales enable efficient data collection, particularly in large-scale surveys. Their straightforward format allows for quick responses, which can be easily digitized and processed using survey software. For instance, an online customer feedback survey using Likert scales can be completed swiftly, and the responses can be automatically aggregated and analyzed. This is especially valuable in large-scale studies, where speed and ease of data collection are critical.
Broad applicability
Likert scales are widely recognized and accepted in research, making them a standard tool in many fields. Their broad applicability and ease of use mean that they can be deployed in various contexts, ensuring consistency and comparability of data. For example, they are commonly used in academic research, market research, and public opinion polling. Their acceptance across different disciplines enhances the credibility and comparability of the research findings.
What are some limitations of Likert scales?
Central tendency bias
Central tendency bias occurs when respondents avoid extreme response options and gravitate towards the middle of the scale. This can lead to inaccurate data as it doesn’t reflect true opinions. For example, in a satisfaction survey, respondents may consistently choose "neutral" or "somewhat agree" instead of "strongly agree" or "strongly disagree," which obscures actual levels of satisfaction or dissatisfaction. This bias can result in a data set that is less informative and fails to highlight significant trends or issues that need addressing.
Acquiescence bias
Acquiescence bias happens when respondents have a tendency to agree with statements regardless of their true feelings, often to please the researcher or because they find it easier. For example, in a survey asking for opinions on a new product feature, respondents might agree with positive statements even if they don’t genuinely feel that way. This bias can inflate positive responses, making it challenging to identify actual problems or areas for improvement. To mitigate this, researchers can include reverse-coded items and ensure statements are balanced between positive and negative.
Limited depth of insight
While Likert scales are useful for quantifying attitudes and opinions, they often lack depth. They don’t capture the reasons behind a respondent’s choice, which can be critical for understanding the context of the feedback. For example, a respondent might rate a customer service experience as "neutral" but the scale does not reveal whether this is due to long wait times, unhelpful staff, or other factors. To gain deeper insights, it’s best to complement Likert scales with open-ended questions that allow respondents to elaborate on their ratings.
Cultural bias
Cultural differences can influence how respondents interpret and use Likert scales. In some cultures, individuals may be more inclined to choose extreme responses, while in others, people might avoid extremes to appear modest. For example, in a global survey on employee engagement, cultural tendencies might skew results, with some countries showing consistently higher or lower satisfaction levels. This cultural bias can distort the data, making it difficult to draw accurate comparisons across different groups. Researchers must be aware of these cultural nuances and consider them when designing surveys and interpreting results.
Ambiguity in interpretation
Respondents might interpret the points on the Likert scale differently, leading to inconsistent responses. Terms like "agree" or "neutral" can be subjective and mean different things to different people. For example, what one respondent considers "agree" might be seen as "strongly agree" by another, resulting in varied interpretations of the same question. This ambiguity can affect the reliability of the data. To address this, it is crucial to provide clear definitions or examples for each scale point to ensure consistent understanding among respondents.
Response style differences
Individuals have different response styles, which can impact how they use Likert scales. Some people tend to avoid extreme responses (central tendency), while others might consistently choose high or low ends of the scale (leniency or severity bias). For instance, in a performance appraisal survey, one employee might rate all aspects as "excellent" while another rates them as "average," despite similar actual performance levels. These differences in response styles can skew results and complicate the interpretation of data. Using statistical techniques to adjust for these biases can help improve accuracy.
Halo effect
The halo effect occurs when respondents' overall impression of a subject influences their ratings on specific items. For example, if a respondent has a positive overall impression of a company, they might rate all aspects of its service highly, regardless of individual experiences. This can lead to inflated scores and a lack of differentiation between different aspects of the service. To counteract this, researchers can design surveys with varied and specific questions that encourage respondents to consider each aspect independently rather than being influenced by their general impression.
Social desirability bias
Social desirability bias happens when respondents answer questions in a manner they believe is socially acceptable or favorable rather than their true feelings. For instance, in a survey about ethical behavior, respondents might over-report positive behaviors and under-report negative ones to present themselves in a better light. This bias can distort the data, making it challenging to get an accurate picture of actual attitudes or behaviors. Anonymity in responses and careful question phrasing can help reduce this bias, encouraging more honest and accurate responses.
Inability to capture complexity
Likert scales are limited in their ability to capture complex attitudes or behaviors. They reduce responses to a single dimension, which may oversimplify the respondent's true feelings. For example, in a survey on political opinions, a single statement rated on a Likert scale may not fully capture the nuances of an individual's views. To address this limitation, researchers can use multi-dimensional scales or combine Likert scales with qualitative methods like interviews or focus groups to gain a richer, more comprehensive understanding of the subject.
What are some questions that can be asked on a Likert scale?
Here are some types of Likert scale questions that can be asked on a Likert scale:
Customer satisfaction: “How satisfied are you with our customer service?” (Very dissatisfied-Dissatisfied-Neutral-Satisfied-Very satisfied)
Product quality: “How would you rate the quality of our product?” (Very poor-Poor-Average-Good-Excellent)
Ease of use: “How easy is it to navigate our website?” (Very difficult-Difficult-Neutral-Easy-Very easy)
Employee engagement: ”How engaged do you feel with your work?” (Not engaged-Slightly Engaged-Neutral-Engaged-Very engaged)
Agreement with statements: “I feel that my work is valued by my company.” (Strongly disagree-Disagree-Neutral-Agree-Strongly agree)
Likelihood to recommend: “How likely are you to recommend our service to a friend or colleague?” (Very unlikely-Unlikely-Neutral-Likely-Very likely)
Feature importance: “How important is this feature to you?” (Not important-Slightly important-Neutral-Important-Very important)
User experience: “How would you rate your overall experience with our app?” (Very bad-Bad-Neutral-Good-Very good)
Trust in brand: “How much do you trust our brand?” (Not at all-Slightly-Neutral-Mostly-Completely)
Service reliability: “How reliable do you find our service?” (Very unreliable-Unreliable-Neutral-Reliable-Very reliable)


.jpg)