When using data to inform business decisions and predict market trends, it's not enough to just collect and analyze the data—you must ensure it’s relevant and valuable.
The challenge is that numerous factors can impact business data, such as market conditions, economic changes, and even the weather. Therefore, it's crucial to identify which variables are influencing your data and predictions and which data can be ignored.
One of the best ways to assess data value and monitor trends, as well as the relationships between them, is through regression analysis. This set of statistical methods helps estimate the relationships between independent and dependent variables.
In this guide, we will explain the basics of regression analysis, including what it is, how it works, its benefits, and practical applications.
Also, read - Correlational Research
What is Regression Analysis?
Regression analysis is a powerful statistical method used to examine the relationship between two or more variables. By analyzing the connections between independent variables (predictors) and a dependent variable (outcome), regression analysis helps in understanding how the typical value of the dependent variable changes when any one of the independent variables is varied, while the other independent variables are held fixed.
Example of Regression Analysis
Scenario: Evaluating the Effectiveness of Different Marketing Strategies
Suppose a company wants to understand how different marketing strategies impact consumer purchasing behavior. They use various tools powered by AI for this purpose, such as media testing, shopper testing, ad testing, content testing, concept testing, surveys, and qualitative studies.
Steps to Use Regression Analysis
Define the Variables
Dependent Variable: Consumer purchase behavior (e.g., number of purchases, purchase frequency, purchase amount).
Independent Variables:
- Media Testing Scores
- Shopper Testing Scores
- Ad Testing Scores
- Content Testing Scores
- Concept Testing Scores
- Survey Results
- Qualitative Study Insights
Data Collection: Gather data from various sources. For instance, survey results might be numerical scores, while qualitative studies might be coded into quantitative data using AI.
Data Preprocessing: Clean the data to handle missing values, normalize the scores if needed, and ensure that all data points are usable.
Model Building: Use regression analysis to create a model. For example, a multiple linear regression model might look like this:
Purchase Behavior=β0+β1(Media Testing Score)+β2(Shopper Testing Score)+β3(Ad Testing Score)+β4(Content Testing Score)+β5(Concept Testing Score)+β6(Survey Result)+β7(Qualitative Study Insight)+ϵ
Analysis and Interpretation:
- Analyze the coefficients to see which marketing strategies significantly impact purchase behavior.
- Check the R-squared value to understand how well the independent variables explain the variation in the dependent variable.
- Use p-values to determine the statistical significance of each independent variable.
Decision-Making:
- Based on the analysis, the company can make informed decisions about which marketing strategies are most effective.
- They might decide to allocate more of their budget to high-impact strategies or redesign low-impact strategies.
Practical Application
An AI-powered platform could automate much of this process. For example, the platform could continuously collect and analyze data from ongoing media tests, shopper tests, ad tests, and more. It could update the regression model in real-time, providing the company with up-to-date insights and recommendations.
By using regression analysis in this way, companies can ensure their marketing efforts are data-driven and highly effective, ultimately leading to better consumer engagement and increased sales.
Types of Regression Analysis

Linear Regression
Linear regression models the relationship between a single independent variable and a dependent variable as a straight line.
Example: Copy Testing
- Use Case: Evaluating the impact of ad copy length on click-through rates (CTR).
- Dependent Variable: Click-through rate (CTR)
- Independent Variable: Ad copy length (number of words)
- Scenario: A marketing manager uses linear regression to determine the optimal length for ad copy that maximizes CTR.
Multiple Linear Regression
Multiple linear regression uses multiple independent variables to predict a dependent variable.
Example: Product Insights
- Use Case: Understanding how various features of a new product affect customer satisfaction.
- Dependent Variable: Customer satisfaction score
- Independent Variables: Product quality, ease of use, price, customer support
- Scenario: A product manager uses multiple linear regression to identify which product features have the most significant impact on customer satisfaction.
Polynomial Regression
Polynomial regression models the relationship between the dependent variable and independent variables as an nth-degree polynomial.
Example: Ad Testing
- Use Case: Modeling the impact of advertising frequency on brand recall over time.
- Dependent Variable: Brand recall score
- Independent Variable: Number of ad exposures
- Scenario: A brand marketing manager uses polynomial regression to understand how brand recall improves with increasing ad exposures, capturing the nonlinear relationship.
Logistic Regression
Logistic regression is used when the dependent variable is binary (e.g., yes/no, true/false). It models the probability of a certain class or event.
Example: NPS & CSAT
- Use Case: Predicting whether a customer will give a high Net Promoter Score (NPS) based on their interaction history.
- Dependent Variable: High NPS (yes/no)
- Independent Variables: Number of support interactions, resolution time, customer tenure
- Scenario: A customer experience manager uses logistic regression to predict which customers are likely to become promoters, allowing targeted actions to improve NPS.
Ridge Regression
Ridge regression is used to address multicollinearity by adding a degree of bias to the regression estimates.
Example: Concept Testing
- Use Case: Assessing the impact of various concept attributes on purchase intent.
- Dependent Variable: Purchase intent score
- Independent Variables: Concept appeal, uniqueness, relevance, clarity
- Scenario: A market researcher uses ridge regression to handle correlated concept attributes and determine their effect on purchase intent.
Lasso Regression
Lasso regression performs variable selection by adding a penalty equal to the absolute value of the magnitude of coefficients.
Example: Feedback & Sentiment Analysis
- Use Case: Identifying key factors from customer feedback that influence overall sentiment.
- Dependent Variable: Sentiment score (positive/negative)
- Independent Variables: Various feedback attributes (e.g., product quality, delivery time, customer service)
- Scenario: A consumer insights manager uses lasso regression to highlight the most significant feedback attributes affecting customer sentiment, guiding improvement initiatives.
Elastic Net Regression
Explanation: Elastic net regression combines ridge and lasso regression penalties to improve prediction accuracy.
Example: Journey Mapping
- Use Case: Understanding the impact of various touchpoints on customer journey satisfaction.
- Dependent Variable: Customer journey satisfaction score
- Independent Variables: Website usability, customer service, product quality, delivery speed
- Scenario: A UX researcher uses elastic net regression to predict customer journey satisfaction by considering a mix of touchpoints, even when some are correlated.
Stepwise Regression
Stepwise regression adds or removes predictors based on their statistical significance to find the best model.
Example: New Product Research
- Use Case: Determining the most important factors influencing the likelihood of adopting a new product.
- Dependent Variable: Likelihood of adoption
- Independent Variables: Price, product features, brand reputation, marketing efforts
- Scenario: A product manager uses stepwise regression to identify the most critical factors affecting new product adoption, aiding in strategic planning.
Hierarchical Regression
Hierarchical regression is used to understand the incremental value of adding sets of predictors to a regression model.
Example: Product Launch Interviews
- Use Case: Evaluating the impact of initial market reactions and subsequent promotional efforts on product success.
- Dependent Variable: Product success score
- Independent Variables:some text
- Block 1: Initial market reactions (pre-launch surveys, focus group feedback)
- Block 2: Promotional efforts (advertising spend, social media engagement)
- Scenario: A brand marketing manager uses hierarchical regression to determine how much promotional efforts contribute to product success after accounting for initial market reactions, guiding future launch strategies.
Advantages of Regression Analysis

Regression analysis is a powerful statistical tool used in consumer research to understand relationships between variables and to make predictions. Here are some key advantages:
Understanding Relationships
- Identify Influences: Regression analysis helps in identifying and quantifying the relationship between a dependent variable (e.g., consumer satisfaction) and one or more independent variables (e.g., price, product quality).
- The magnitude of Impact: It allows researchers to understand the strength of impact each independent variable has on the dependent variable, which can inform strategic decisions.
Prediction and Forecasting
- Future Trends: By understanding past behaviors and relationships, regression models can be used to predict future consumer behaviors and trends.
- Scenario Analysis: Businesses can simulate different scenarios to see potential outcomes, helping in strategic planning and decision-making.
Quantitative Insights
- Objective Measurement: Provides a quantitative approach to measure and analyze consumer behaviors and preferences, reducing subjectivity.
- Data-Driven Decisions: Facilitates data-driven decision-making by providing empirical evidence to support hypotheses.
Handling Multiple Variables
- Multivariate Analysis: Regression can handle multiple independent variables simultaneously, which is essential for understanding complex consumer behaviors influenced by various factors.
- Control for Confounding Variables: It allows researchers to control for other variables that might affect the dependent variable, isolating the impact of the primary variable of interest.
Improving Marketing Strategies
- Targeted Marketing: Helps in identifying key drivers of consumer behavior, allowing for more targeted and effective marketing strategies.
- Resource Allocation: Businesses can allocate resources more efficiently by understanding which factors most significantly influence consumer behavior.
Enhancing Product Development
- Consumer Preferences: By understanding the factors that most influence consumer preferences, companies can tailor their product development efforts to meet market demands.
- Feature Prioritization: Regression can help in prioritizing product features based on their impact on consumer satisfaction or purchase intent.
Measuring Campaign Effectiveness
- Ad and Campaign Performance: It can be used to measure the effectiveness of advertising campaigns by analyzing the impact of various elements like ad spend, media type, and messaging on consumer responses.
- ROI Analysis: Helps in calculating the return on investment (ROI) for marketing campaigns, guiding budget allocations.
Improving Customer Experience
- Feedback Analysis: Regression analysis can analyze customer feedback to identify key factors contributing to satisfaction or dissatisfaction.
- Personalization: Businesses can use insights from regression analysis to personalize customer experiences, enhancing satisfaction and loyalty.
Competitive Analysis
- Benchmarking: It enables comparison with competitors by understanding the factors influencing consumer choices in the industry.
- Market Positioning: Helps in identifying strengths and weaknesses relative to competitors, guiding market positioning strategies.
Supporting Concept and Product Testing
- Concept Testing: Regression can evaluate how different concepts or features influence consumer interest and purchase intent, guiding product development.
- Prototype Testing: Analyzes how consumers respond to prototypes, identifying which features are most important and which need improvement.
Application of Regression Analysis in Specific Use Cases
- Ad Testing: Measure the impact of different ad elements (e.g., visuals, messages) on consumer response.
- NPS & CSAT: Identify key drivers of Net Promoter Score (NPS) and Customer Satisfaction (CSAT) to enhance customer loyalty.
- Brand Tracking: Track how different factors influence brand perception over time.
- Journey Mapping: Understand how different touchpoints in the customer journey affect overall satisfaction and behavior.
Frequently Asked Questions
What is the main purpose of regression analysis?
Typically, regression analysis serves two main purposes: predicting the dependent variable's value based on available explanatory variables or estimating how an explanatory variable affects the dependent variable.
How to calculate regression?
In simple linear regression, the formula is Y = mX + b. Here, Y represents the response or dependent variable, X denotes the predictor or independent variable, m is the slope estimate, and b is the intercept estimate.
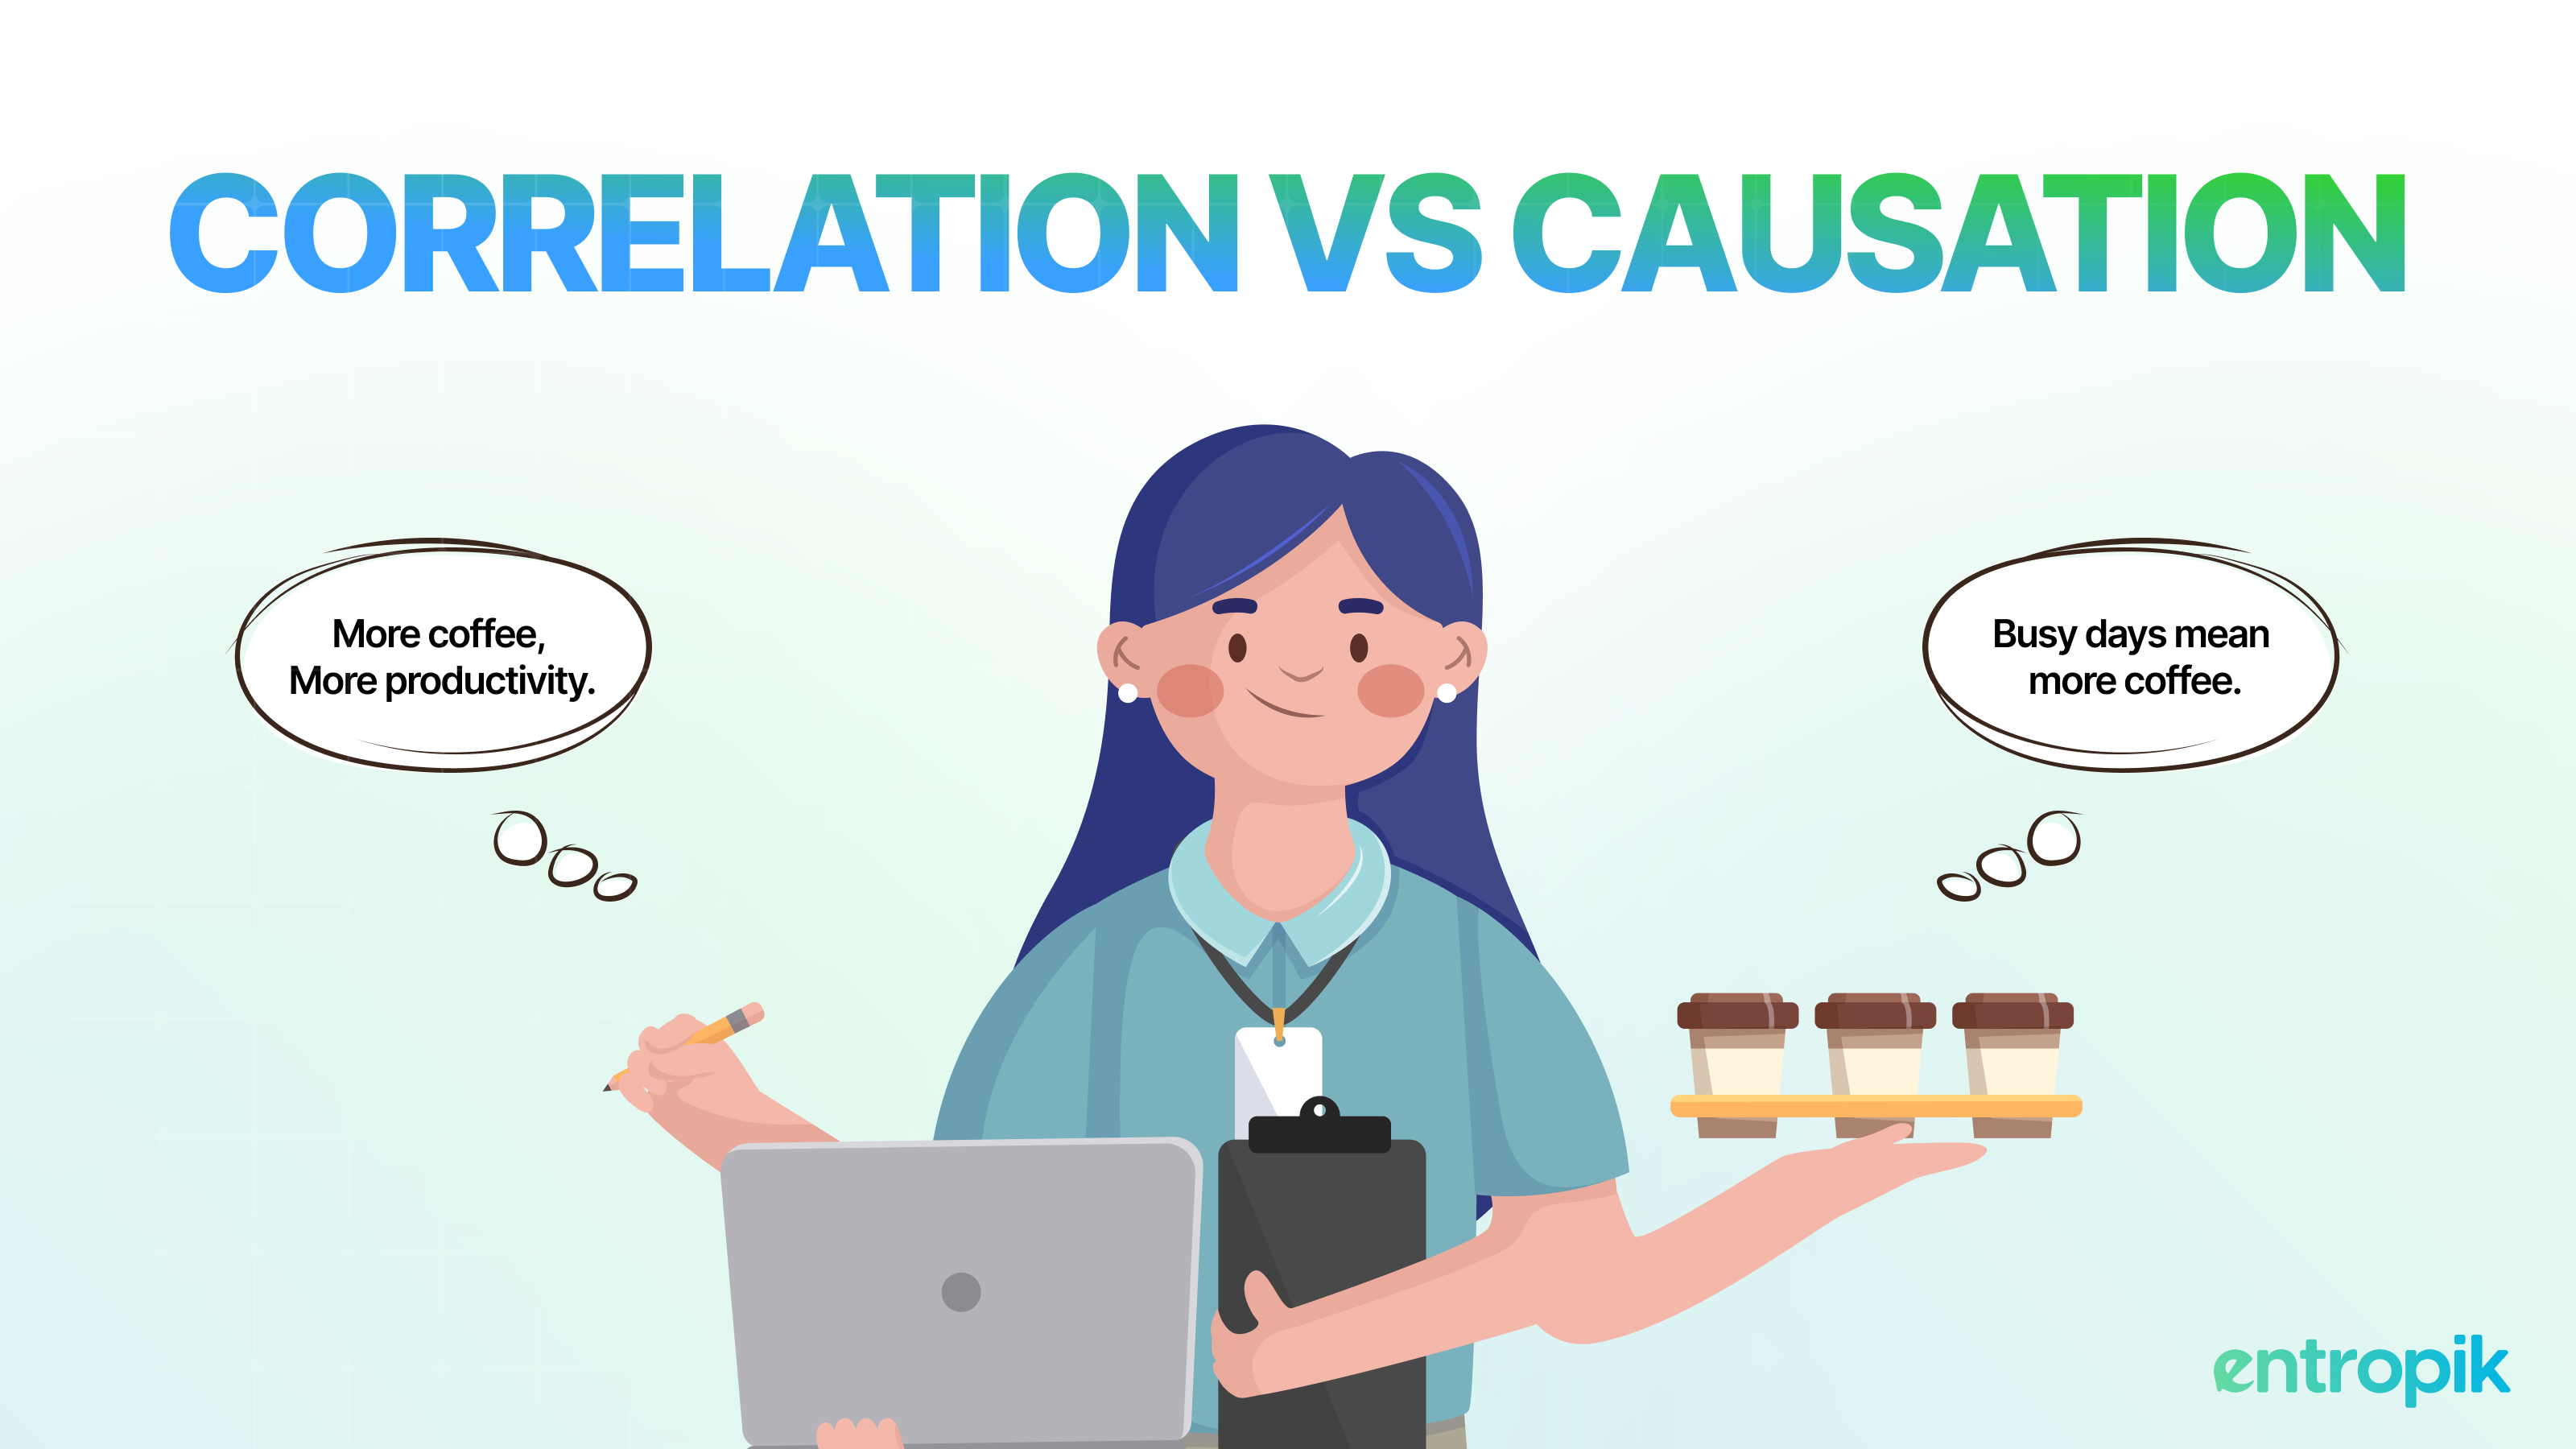
What is the difference between correlation and regression?
Correlation measures the strength and direction of the linear relationship between two variables, providing a numerical value between -1 and 1. Regression, on the other hand, goes beyond correlation by modeling how changes in one variable (independent) are associated with changes in another (dependent), quantifying this relationship with an equation.
{{cta-button}}


.jpg)