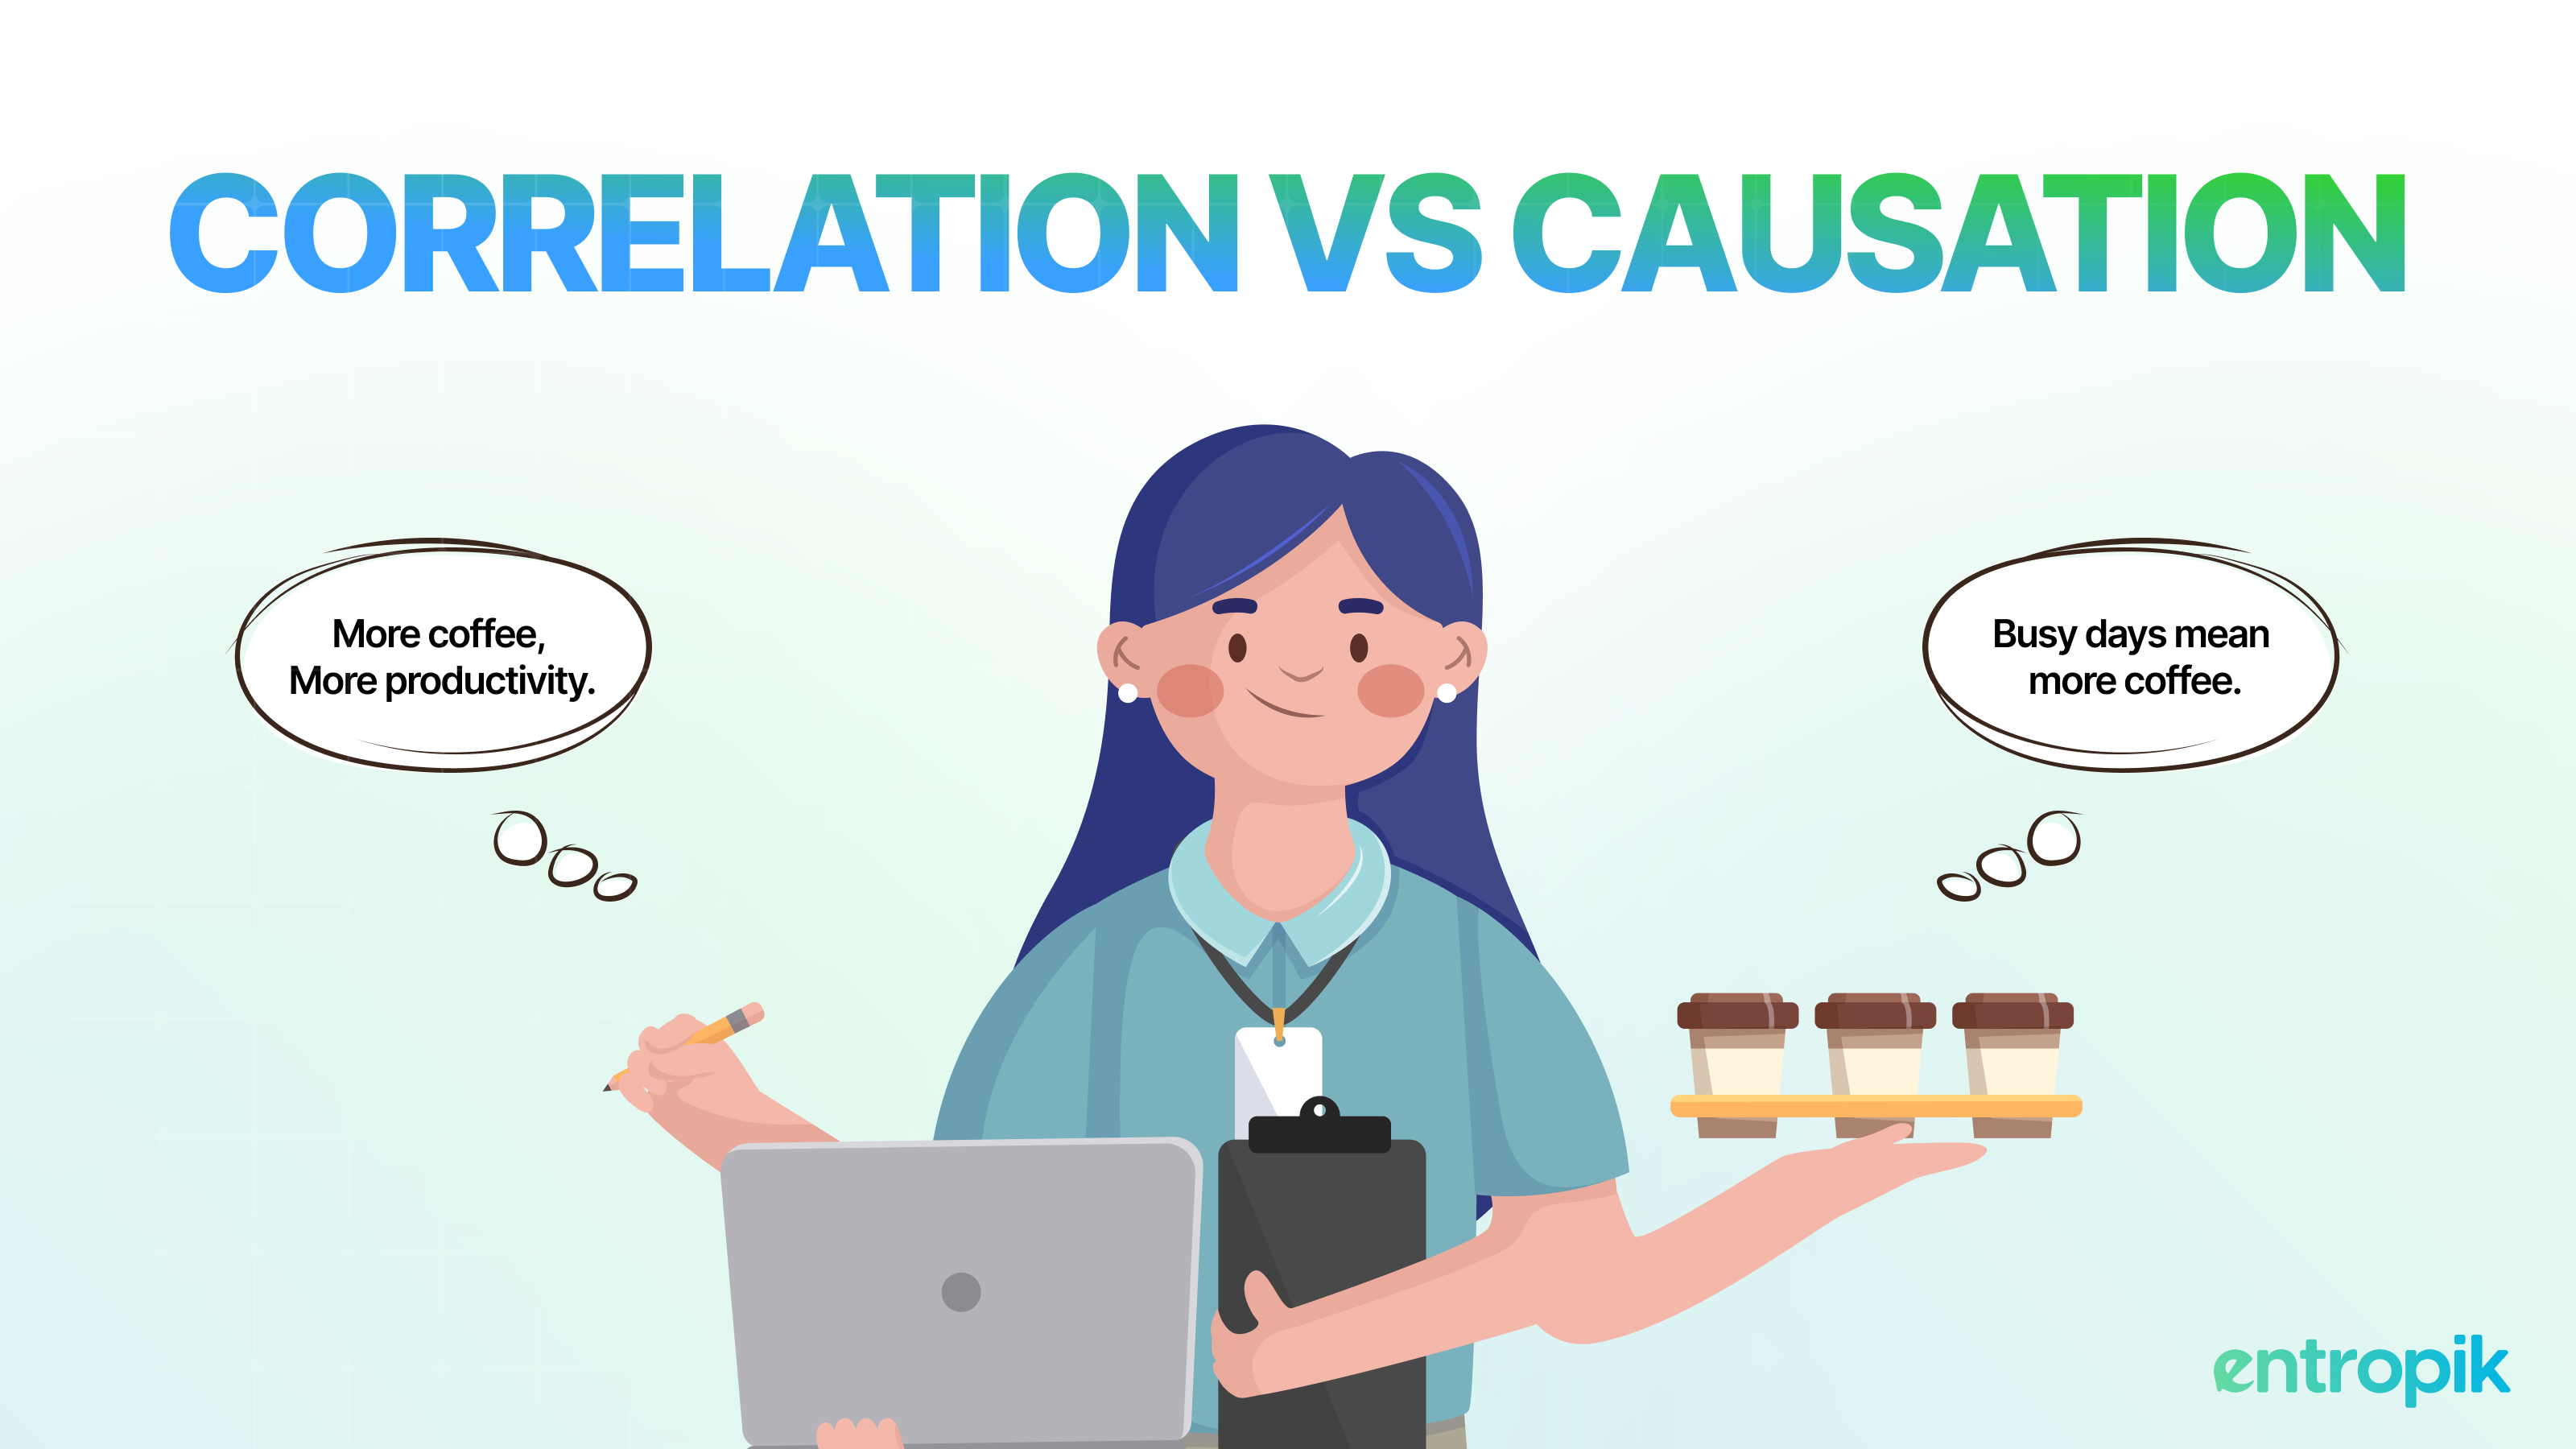
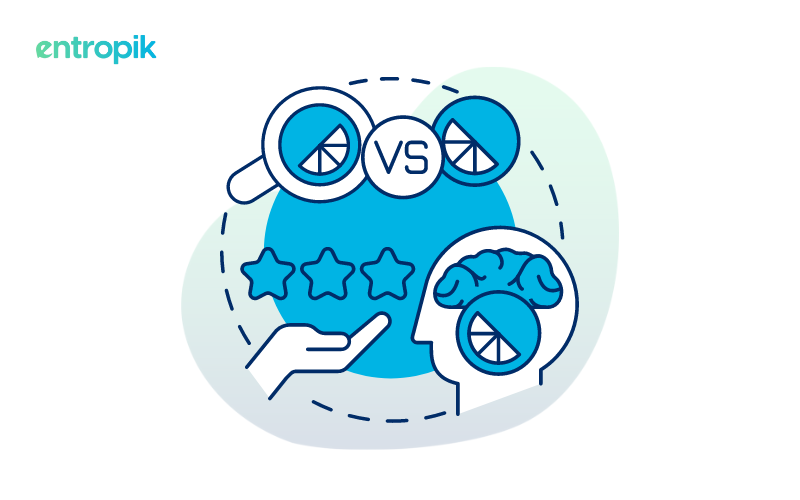
Ever wondered if spending more time on social media affects your well-being or if hitting the gym more often boosts academic performance? Well, those are the kinds of questions that drive correlational research. It's a method researchers use to explore how things are linked without jumping to conclusions about cause and effect.
The big question in correlational research is this: Can we really say one thing causes another just because they're connected? Take the example of kids who own more books—they might seem to do better in school. But hold on, it's not just about the books; it could also be because their parents are super involved in their education.
It's like when you see more ice cream sold and more people drowning in the summer. It doesn't mean ice cream causes drownings; it's just that warm weather makes both happen more. So, when we talk about correlations, we're saying two things go hand in hand, but we need to be careful not to jump to conclusions about one causing the other.
Read on as we delve into the nuances of correlational research, its types, characters, and ways to conduct it with correlation examples.
What is Correlational Research?
Correlational research, also known as correlational study, is a type of descriptive research that helps assess how two variables may vary together. In this method, researchers analyze the relationship and characteristics between each variable without manipulating them. It's important to note that while a correlation can identify a connection, it cannot establish causation or prove that changing one variable will directly impact the other in a cause-and-effect manner.
In statistical analysis, it's crucial to differentiate between categorical and numerical data. Categorical data comprises distinct categories or labels, whereas numerical data involves measurable quantities. Understanding this distinction is fundamental for accurate analysis and interpretation.
How is Correlation Measured?
In gauging the correlation between two variables, we employ a statistical tool called a correlation coefficient, often referred to as Pearson’s Correlation Coefficient or Pearson’s ‘r.’ This numerical value always falls within the range of -1 to 1.
The correlation coefficient is a statistical measure indicating the strength of the relationship between two variables, with values ranging from -1 to +1. A coefficient nearing +1 signifies a positive correlation, suggesting that as one variable increases, the other tends to increase as well. Conversely, a value approaching -1 indicates a negative correlation, implying that as one variable increases, the other tends to decrease. When the coefficient is close to zero, it suggests no significant relationship between the two variables.
Understanding this coefficient helps assess the nature and intensity of associations between variables in statistical analysis. Researchers typically visualize this correlation using a scatterplot, where data points are plotted.

What are the 3 Types of Correlational Studies with Correlational Research Examples
The scatter plot illustrates the correlation between two attributes or variables, showcasing the degree of their connection. There are three scenarios that help us understand the relationship between these variables:
Positive Correlation
This occurs when the values of both variables move in the same direction. An increase or decrease in one variable is followed by a corresponding increase or decrease in the other variable. For example, business growth might positively correlate with good design on social media gauging likes.
Negative Correlation
In this case, the values of the two variables move in opposite directions. An increase or decrease in one variable is followed by a decrease or increase in the other variable.
For example, the gender of the actor in the advertisement might negatively correlate with the attention span of the viewer when an increase in one variable leads to a decrease in another and vice versa. If the gender is changed, it can reduce the attention span. Please note that this doesn’t mean that a higher attention span is because of gender. It only means that attention span and gender are believed to have a common reason – the target audience.
No Correlation
When there is no discernible linear dependence or connection between the two variables, we refer to it as having no correlation. This means changes in one variable do not predict or coincide with changes in the other variable. Understanding these correlations is vital for interpreting the relationship between variables in a formal analysis.
For example, there is no correlation between price and ad quality.
What is Correlational Research and its Characteristics?
Correlational research, a distinct type of research design, possesses key characteristics that set it apart:
Non-experimental Nature
Correlational research design is commonly non-experimental, indicating that researchers refrain from manipulating variables intentionally. Instead, they opt for observing and measuring variables in their natural state, allowing for a more passive approach to data collection.
Backward-Looking Focus
Unlike some research designs that consider the future, correlational research concentrates on the historical relationship between variables. The statistical patterns it reveals are retrospective, and what may have been a positive relationship in the past might alter to negative or zero in the future.
Dynamic Patterns
Correlational research unveils dynamic statistical patterns. The correlation between variables can shift daily, making it unsuitable as a constant variable for further research and analysis. A positive correlation in the past might transform into a negative correlation in the future, highlighting the evolving nature of these relationships.
Use Cases of Correlational Research in Consumer Research
Correlational research finds frequent applications in market research due to its efficiency in quick data collection and generalizing data through observation. It proves valuable in identifying areas for further investigation.
Here are key situations where utilizing correlational research is advantageous:
Exploring Non-Causal Relationships
Employ correlational research when aiming to identify a relationship between two variables without expecting to establish a cause-and-effect link.
Example: Correlational research in marketing might reveal a connection between the frequency of email newsletters and an uptick in website visits. This correlation suggests that there's a pattern of increased website traffic when newsletters are sent, without necessarily implying that newsletters directly cause the traffic surge.
Investigating Potential Causal Relationships
Correlational research is useful when exploring initial indications or developing theories about a potential causal relationship between variables.
Example: A marketing study observes a correlation between the use of promotional discounts and an increase in product purchases. This correlation prompts further investigation into whether offering discounts directly causes a boost in sales, leading to the development of targeted promotional strategies.
Testing New Measurement Tools
When introducing new tools to measure variables, correlational research serves to evaluate their consistency and accuracy.
Example: A company introduces a new metric to measure social media engagement. Correlational research is employed to assess whether higher engagement scores on this new metric align consistently with increased brand awareness or sales, confirming the effectiveness of the measurement tool.
How to Conduct Correlational Research?

Survey
Surveys serve as a quick and efficient means for researchers to collect feedback, often utilizing consumer research platforms with Insights AI. Through a combination of open-ended and close-ended questions, researchers inquire about the variables of interest, with open-ended questions providing a deeper understanding. Subsequently, the collected data is subjected to statistical analysis for interpretation.
Download and Watch - Emotion AI to Eliminate Response Bias and Capture True Consumer Feedback and learn how to capture true consumer feedback.
In field research
Variables are observed in their natural settings. Whether studying customers in physical stores or employing session replay tools in online shops, researchers document behaviors related to the variables of interest. This method offers valuable insights into real-world scenarios.
Secondary Research
Secondary research involves gathering relevant literature and sources related to the study's subject, typically varying based on the industry or topic under examination. By synthesizing these findings and comparing them with the research outcomes, researchers gain a holistic perspective on the variables in question.
Store all your secondary research along with your primary research like surveys in a single repository and gather AI-powered insights.
{{cta-button}}
Bottom Line
To sum it up, correlational research is like a detective tool in the world of science, especially in marketing and consumer research. It helps us explore how things are connected without jumping to conclusions about what causes what. Throughout this journey, we've seen that while correlations show relationships, they don't prove direct cause and effect.
Correlational research has unique features, like not messing with variables on purpose, looking at the past, and understanding that relationships can change over time. We've talked about using surveys and observing real-world situations to gather information and how this method helps us explore different scenarios in marketing, from understanding connections between things to testing new tools.
In a world where things can change, correlational research helps us make sense of the patterns and connections, guiding us to make better decisions and strategies in the ever-changing world of what people buy and why.
Make informed decisions, identify opportunities, and develop effective strategies by conducting correlational research using Decode, an integrated consumer research platform with Insights AI
{{cta-button}}


.jpg)